
October 23, 2013
Data connectivity in mobile terminals has taken asset tracking to a different level. Now, asset tracking is not limited to inventory management, rather we can have online location tracking of moving assets based on their GPS fix. All we need to do is to install a mobile terminal on the asset which can periodically take its GPS fix and report that to a central hub through over-the-air data connectivity.
Apart from sending location data, this service can also facilitate two-way communication between an operator at central hub and an asset user collocated with an asset. This two-way communication can be very useful for the exchange of emergency messages.
GPS-based asset tracking system can also be hosted as a service and can provide coverage over a wide geography.
Key challenges in a GPS-based Asset Tracking System are :
The system is developed such that a service provider can host it and subscribers can register with it to track movement of their assets.
A subscriber contacts customer care and registers for the asset tracking service. After successful registration, an asset tracking terminal is installed on the asset. Asset can be an aircraft, a vehicle, a marine ship or any other object which can be co-located with the terminal. After successful installation of the asset tracking terminal, the asset is provisioned on the billing server and the asset tracking hub (AT Hub).
Each asset gets its GPS fix individually and sends it to AT Hub periodically, through over-the-air data connectivity. For each provisioned asset, AT Hub records the location message in its storage. Subscribers can connect with the AT Hub through a HTTP-based web interface that plots location of each asset online through a geographical map based interface.
![]() Figure 1 : Asset Tracking As a Service
Figure 1 : Asset Tracking As a Service
Subscribers are grouped with in User Groups. Each User Group has a set of assets to be tracked and a set of subscribers who should have sufficient privileges to monitor those assets. Access control is implemented in such a way that a subscriber can view location of only those assets which belong to his/her User Group.
The User Groups can be hierarchical such that a parent organization can view all the assets that belong to its subgroups.
The system also provides an HTTP based interface to operators for managing the service and for administrative functions like managing user accounts, taking backups, etc. Operators are part of the staff of the service provider who keeps the service up & running and performs administrative functions.
Each asset may move with a different velocity and accordingly their frequency to send location messages is required to be different. Therefore, reporting profiles are maintained for each asset type. For example, an aeronautical asset should send its location message every 10 seconds. However, a vehicular asset should send every 5 minutes.
Moreover, since billing is done on the basis of number of location messages processed, therefore different User Groups prefer different frequency of reporting. For example, for intra-city transport, updates might be desired every minute. Whereas for intercity transport, frequency of 30 minutes might be more desirable.
The system provides function to customize reporting frequency of each asset type to each User Group, so that each User Group can configure its assets to report their location messages as relevant for that User Group.
The web-interface of the system, intergrates with map server (i.e. ArcGIS Server) through JavaScript. The
JavaScript interfaces with ‘ArcGIS API for JavaScript’ which pulls in map data from the map server and displays a geographical map. The JavaScript also fetches GPS location data of the desired assets from the Asset Tracking application hosted on a JBoss Application server. The JavaScript plots assets on top of the basemap layer using a graphics layer. Location data is periodically fetched using AJAX based call. The user interface provides functions to drill down a map and take a closer look at the assets & its surroundings.
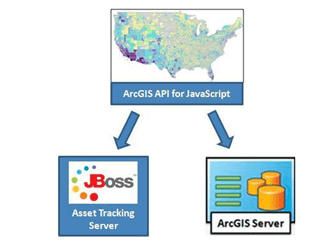
Figure 2: Map server integration
Figure 3 illustrates how a subscriber can view various assets of its User Group, spread over a large geography. Subscriber can click on an asset to view its details in a callout kind of box.
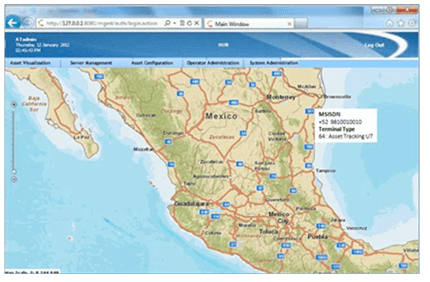 Figure 3: Sample assets location view
Consider a case where a total of 10,000 assets are being managed. Out of that one-third assets send location message every 10 seconds and remaining two-third assets send location message every 30 seconds. If size of each location message is 64 bytes, then this results in data of 64 KB per second ay AT Hub and 5.5 GB per day. If data is required to be maintained for 365 days, then total size of the location records will be approximately 2 terra bytes.
The system is required to be capable of storing such large set of data and to efficiently query the same when data is requested by a subscriber.
The system is required to be available for 99.999% of the time. This means that the system can be down for maximum of 43 minutes in a month and 8.76 hours in an year. This can be made possible through 1:1 hot redundancy, where two identical asset tracking servers work in a cluster which can be accessed through a floating IP address.
Redundancy is facilitated through a state machine, implemented through Linux HA framework. File system is replicated across two redundant servers using DRBD.
1. ArcGIS Resource Center, https://resources.arcgis.com/en/help/getting-started/
2. Similar application, https://www.marinetraffic.com/ais/default.aspx?level0=100